DecisionEngine™
Analytics & Testing Tools Built For Performance Focused Marketers
Leverage Stay’s unparalleled dashboards, predictive analytics, and A/B testing to make strategic, data-driven decisions. Time to manager your subscription program like a performance channel.
Better Data, Better Outcomes
Stay’s data and analytics capabilities are second to none. Make better decisions with a powerful toolset that goes beyond performance dashboards with testing, AI, and more.
| Stay AI | Recharge, etc. | |
|---|---|---|
Predictive AnalyticsLeverage machine learning models to predict customer cohort performance and generate more revenue. | | |
17 Cohort Views & ComparisonsSort cohorts by 17 different variables like revenue growth rate, lifetime value, cumulative orders, etc. | | |
Full A/B Testing With ReportingFully automated testing with automated reporting across 25 KPIs. | | |
Performance Dashboards
Customize to any date range and pick a product to reset your dashboard to just focus on a specific product. Export everything to CSV or integrated with your favorite 3rd party tools. Dashboards so good that other apps have tried to copy them pixel for pixel 😉
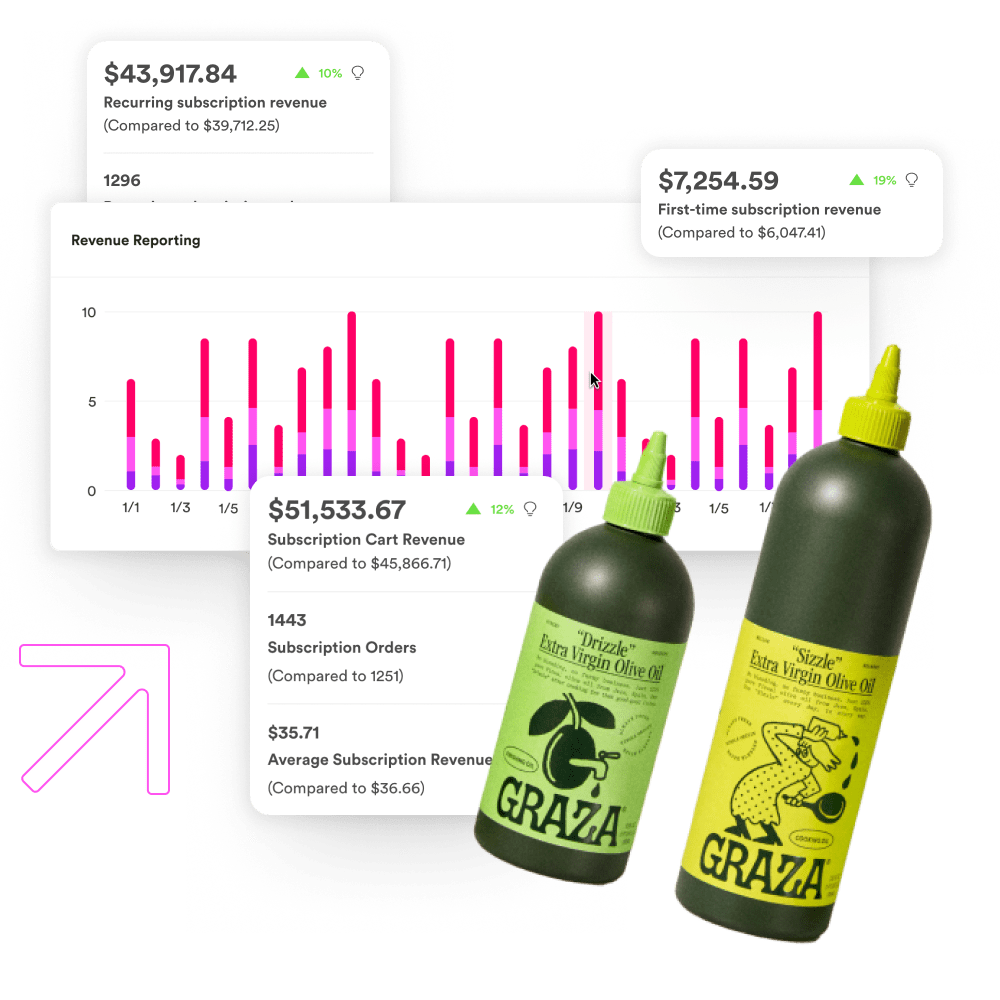
Performance & Revenue Overview
Digestible, actionable, and holistic dashboards with metrics that actually matter for your business. Say goodbye to analysis paralysis and hello to an ever-adapting, data-driven subscription program.
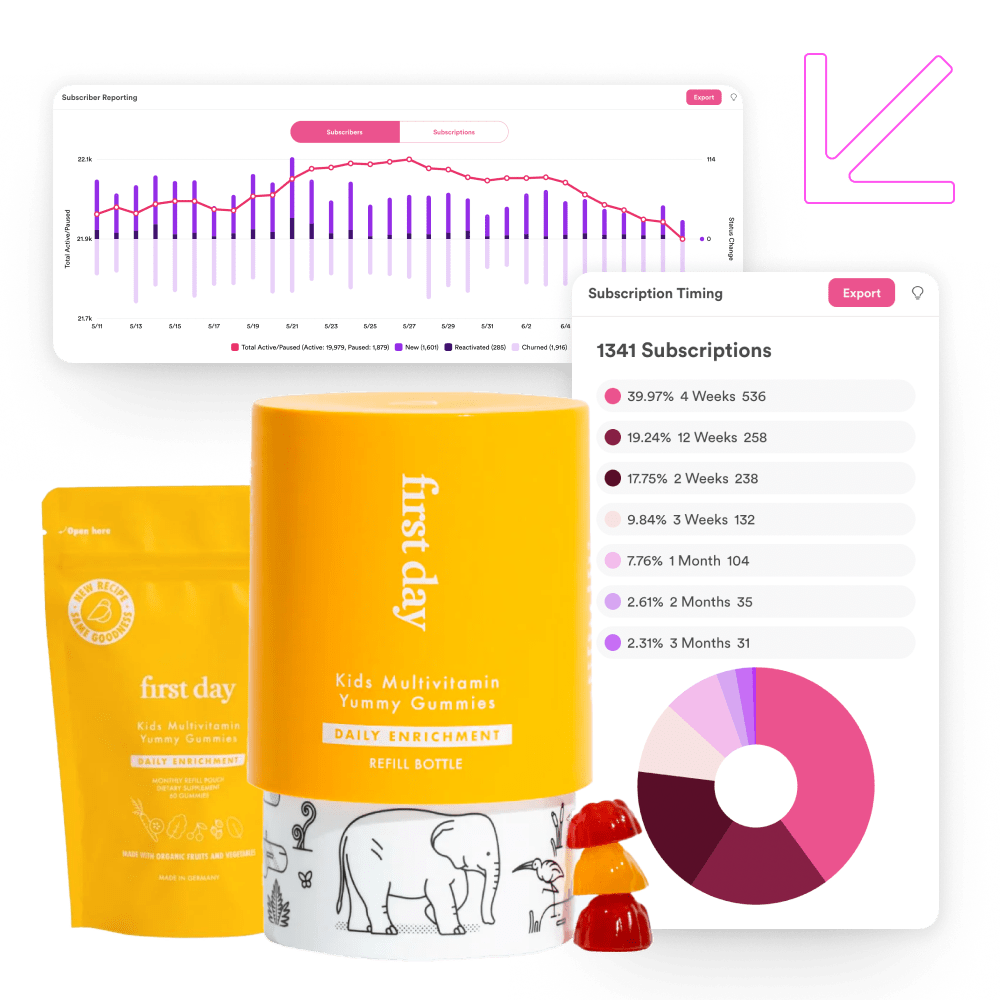
Subscriber Reporting
Digestible visual graphs that give you a snapshot into subscriber health including an overview of active, new, churned subscribers. Keep an eye on subscription timing to ensure a financially healthy program.
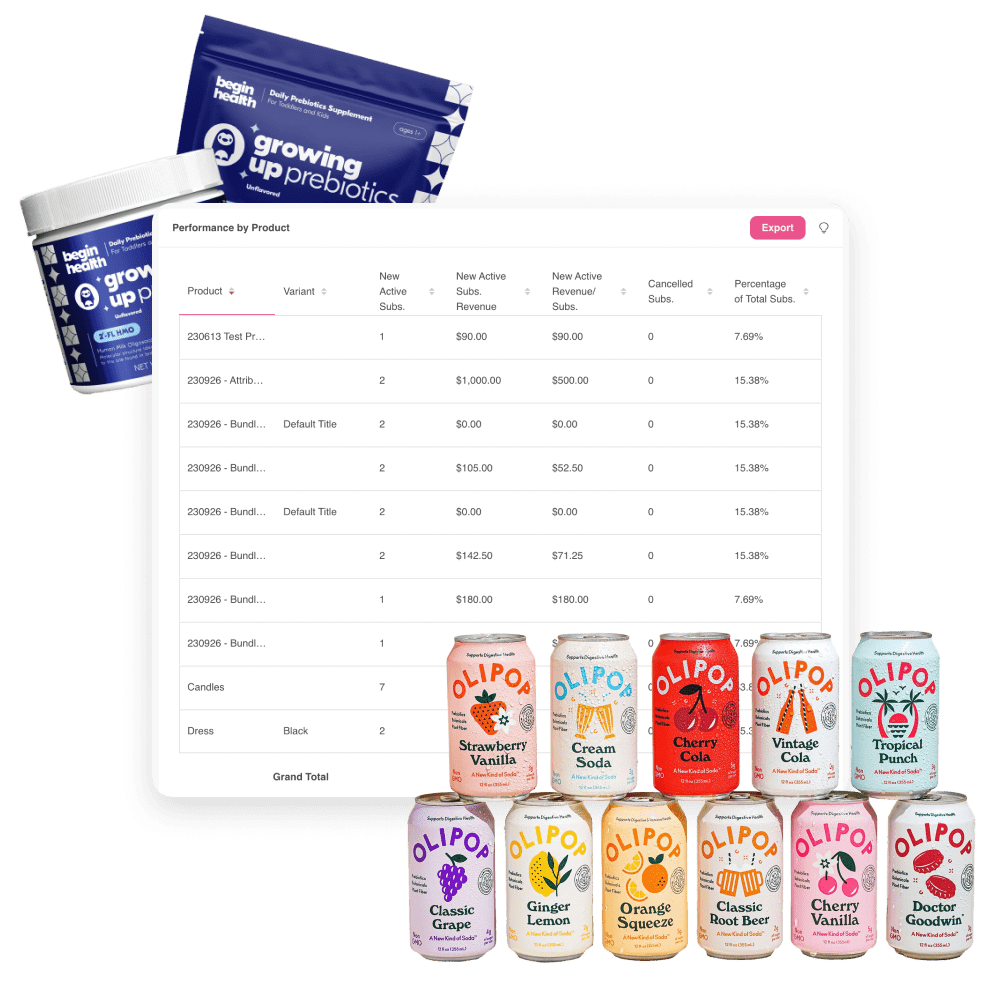
Product Performance
Analyze the best performing products and which products are resulting in higher churn. Quickly identify product trends to make the best acquisition marketing decisions.
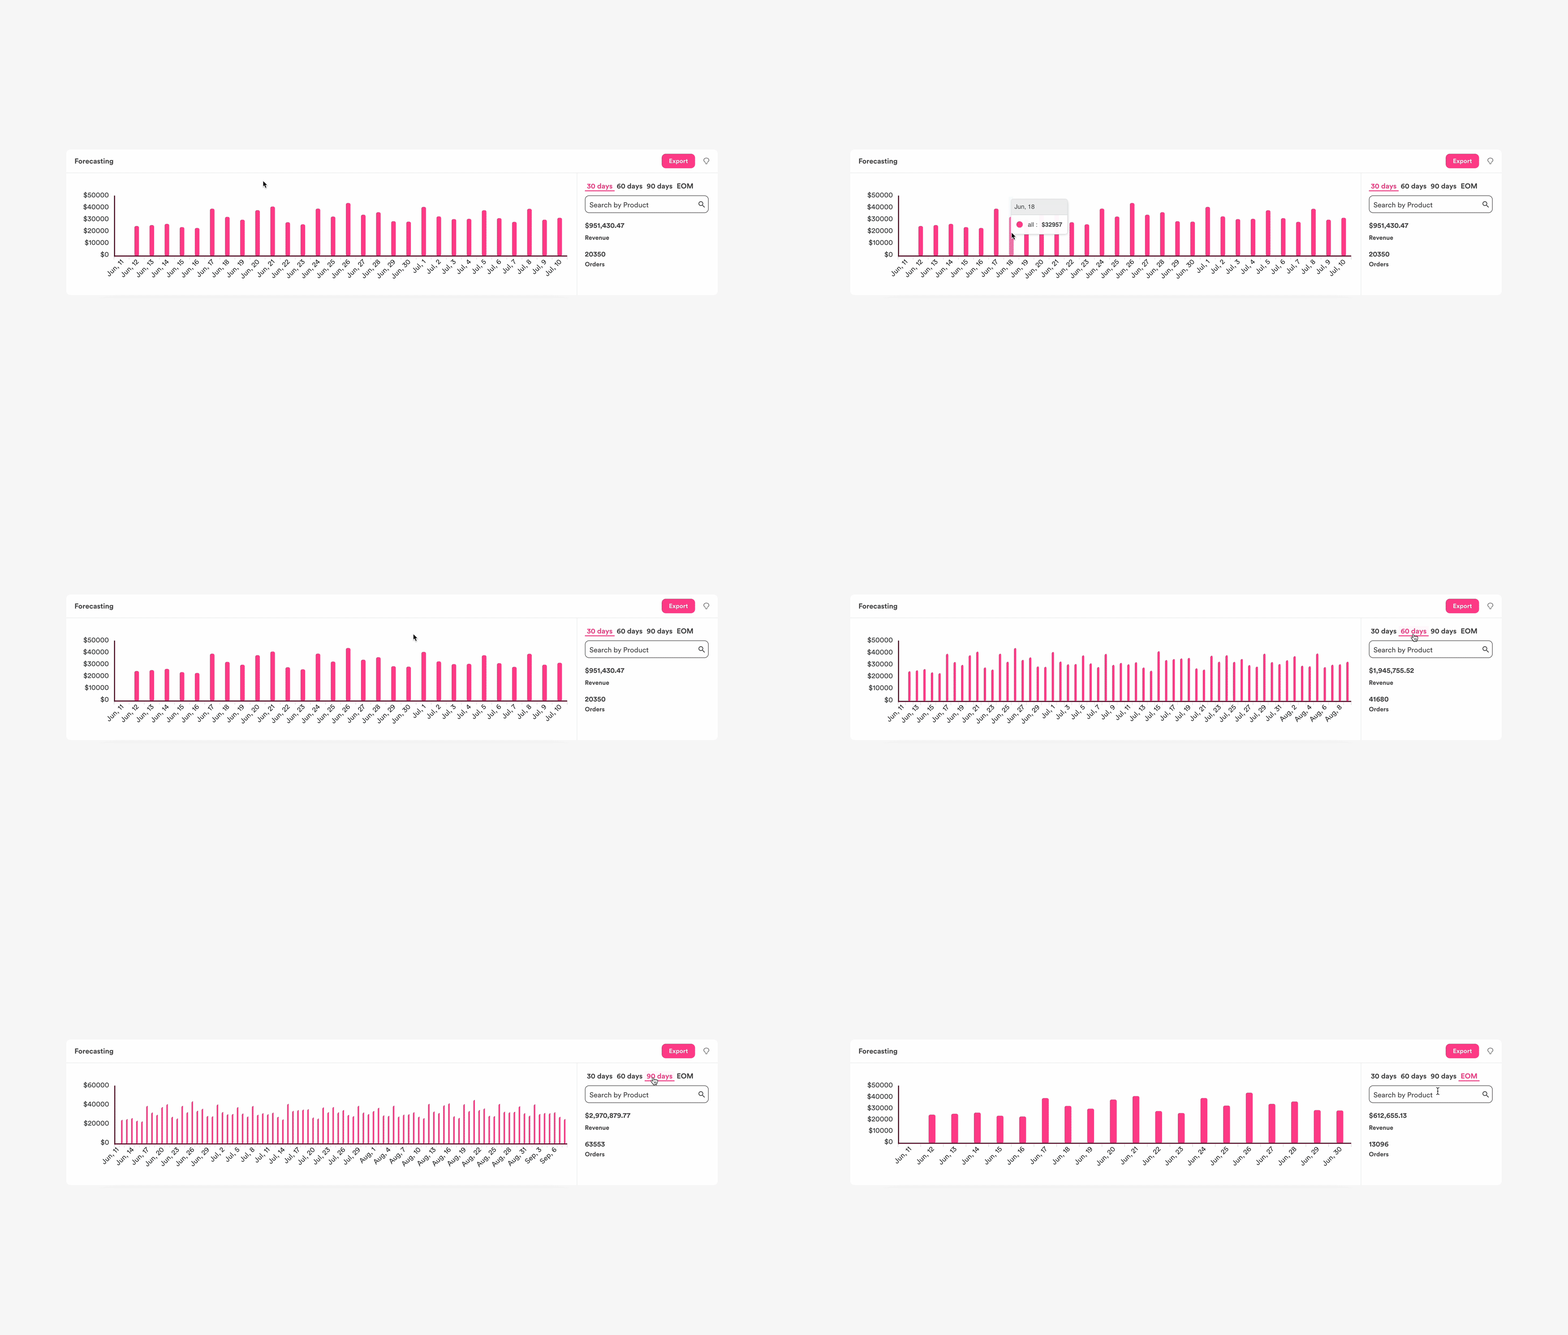
Revenue Forecasting
Forecast revenue by different date ranges to ensure you keep your key SKUs in stock.
Risk Forecasting
Intervene with high-risk subscriber cohorts before its too late by leveraging our proprietary AI-powered churn risk forecasting tool. Analyze risk profiles for different customer segments to better understand where gaps are in your program.
Customer Portal Interactions
Analyze how customers are engaging with your portal to continue to make improvements. Drill down into subscriber behaviors such as skips, reactivations, swaps, pauses, etc.
Analyze Churn Cohorts Based On 17 Variables
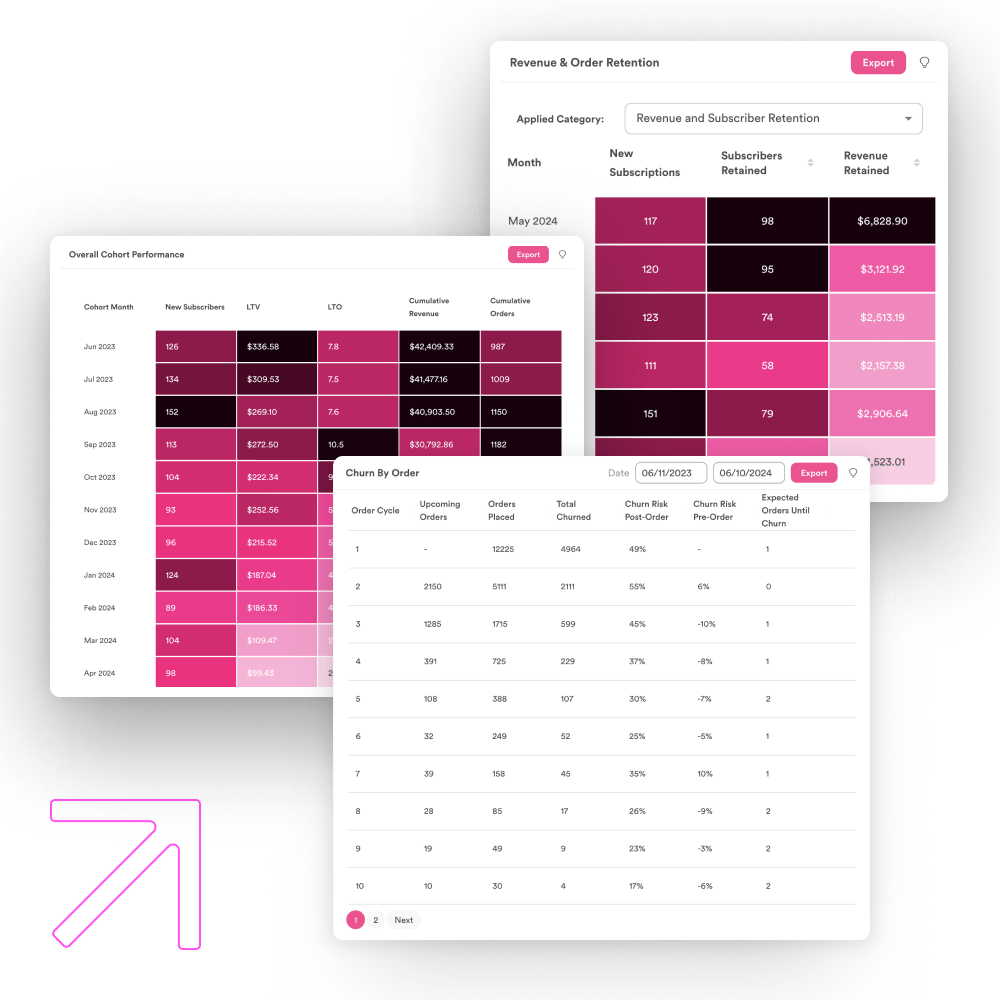
Stay Ai’s easy-to-read churn analytics dashboards help you Understand reasons for churn with cancellation survey response breakdowns, and view churn by SKU Robust cohort comparison graphs allow you to do side-by-side comparisons of 17 different metrics to truly understand performance and churn over time.
All Churn Data At Your Fingertips
A full suite of dashboards give you a 360 view of your program churn. Review monthly reports, churn by order, and export a log of recently churned customers.
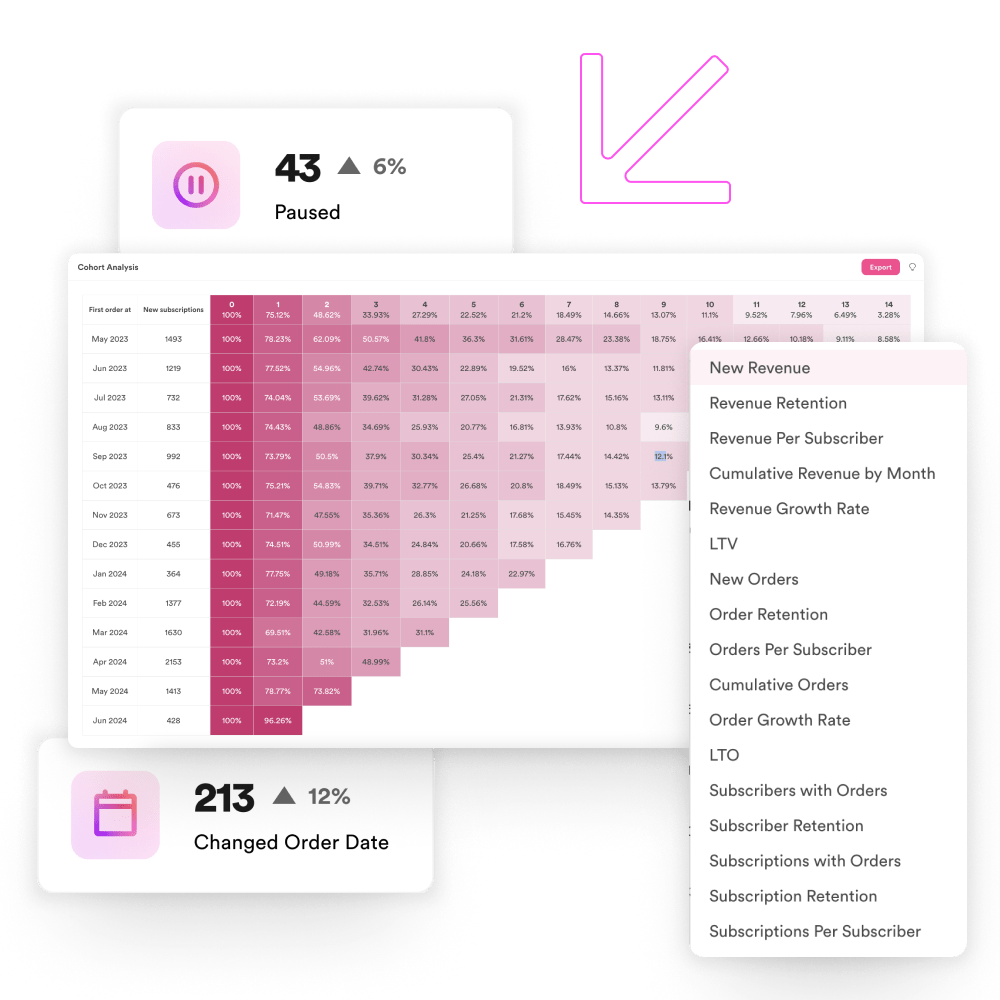
17 Cohort Views
Analyze cohorts based on start month and 17 other variables such as Revenue Per Subscriber, Lifetime Value, Revenue Growth Rate, etc.
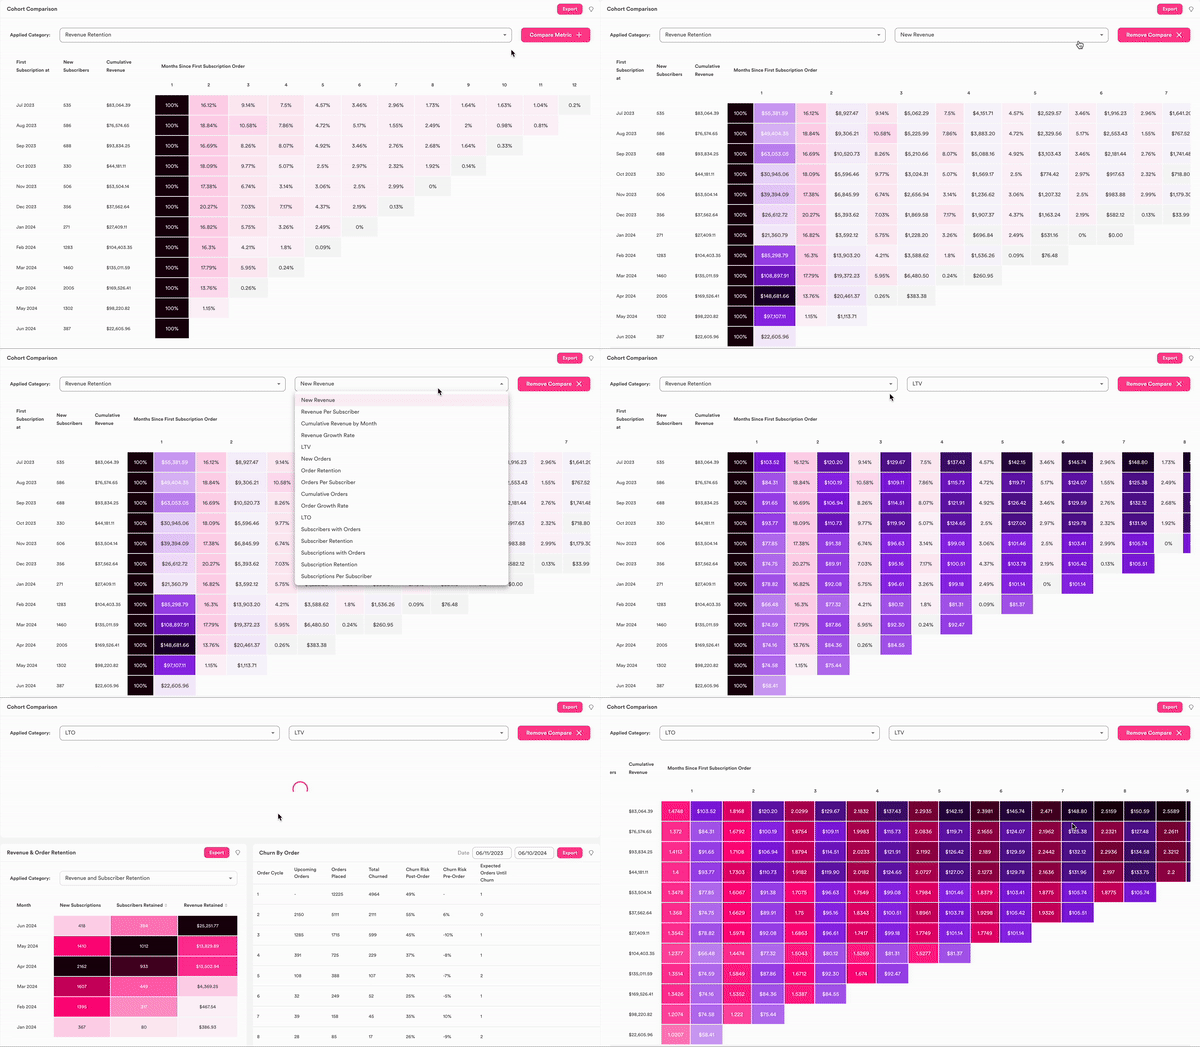
Cohort Comparison By Variable
Beyond reviewing 17 different cohort views you can also apply a comparison to see two variables layered on top of one another for additional analysis.
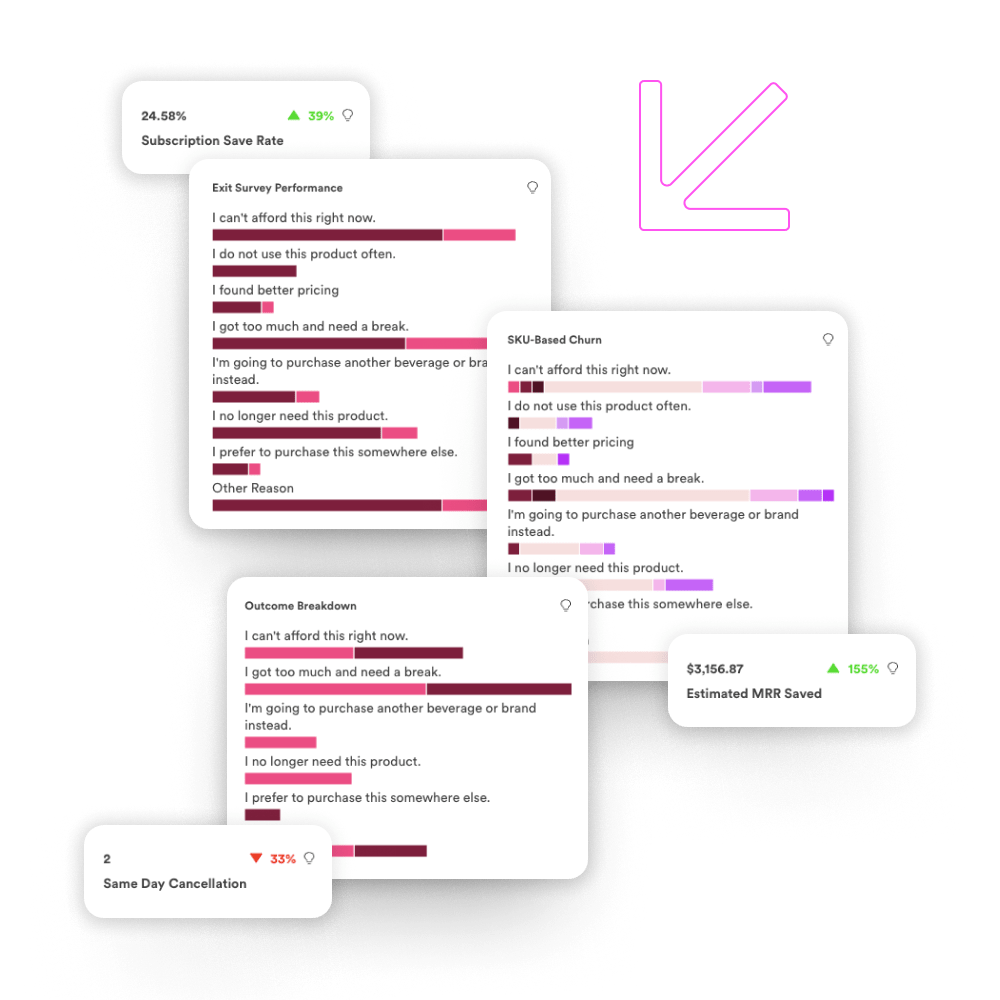
Churn Survey Reporting
RetentionEngine™ is the original churn survey tool for ecommerce. Review exit survey data, SKU based churn, and outcomes for your save experiences.
Remove the guesswork with A/B testing, Reporting
Utilize our analytics infrastructure combined with our experience builder to run automated A/B tests. Improve all of your KPIs by testing promotions, gifts with purchase, and other tactics and monitoring the impact.
Automated A/B Testing
Automated testing allows you to quickly test different products as upsells or the same product with different discount amounts to see what the most successful offer is. Each experience gets detailed reporting on the cohorts LTV, take rate, and retention rate.
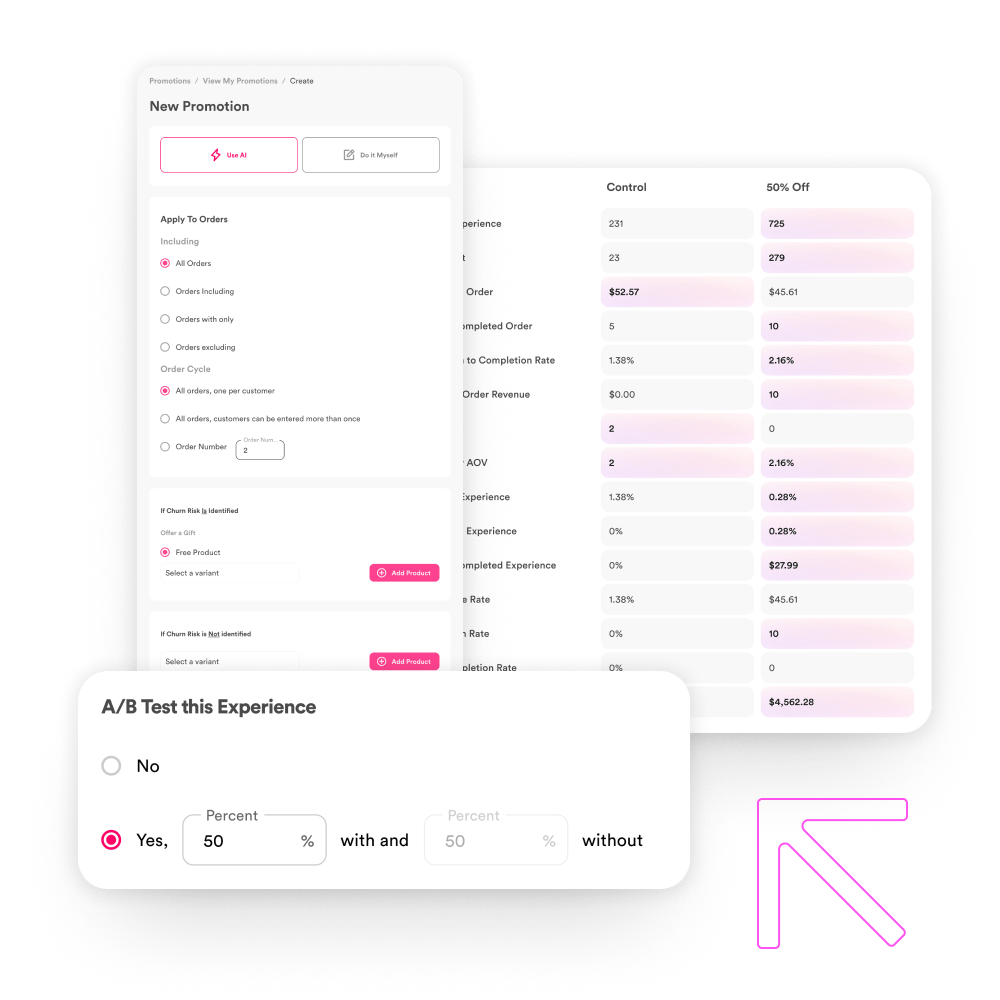
A/B Reporting With 25 KPIs
For each promotional test we provide detailed reporting on 25+ KPIs like lifetime value, take rate, and retention rate. No manual calculations. Our detailed reporting ensures you have everything at your fingertips.
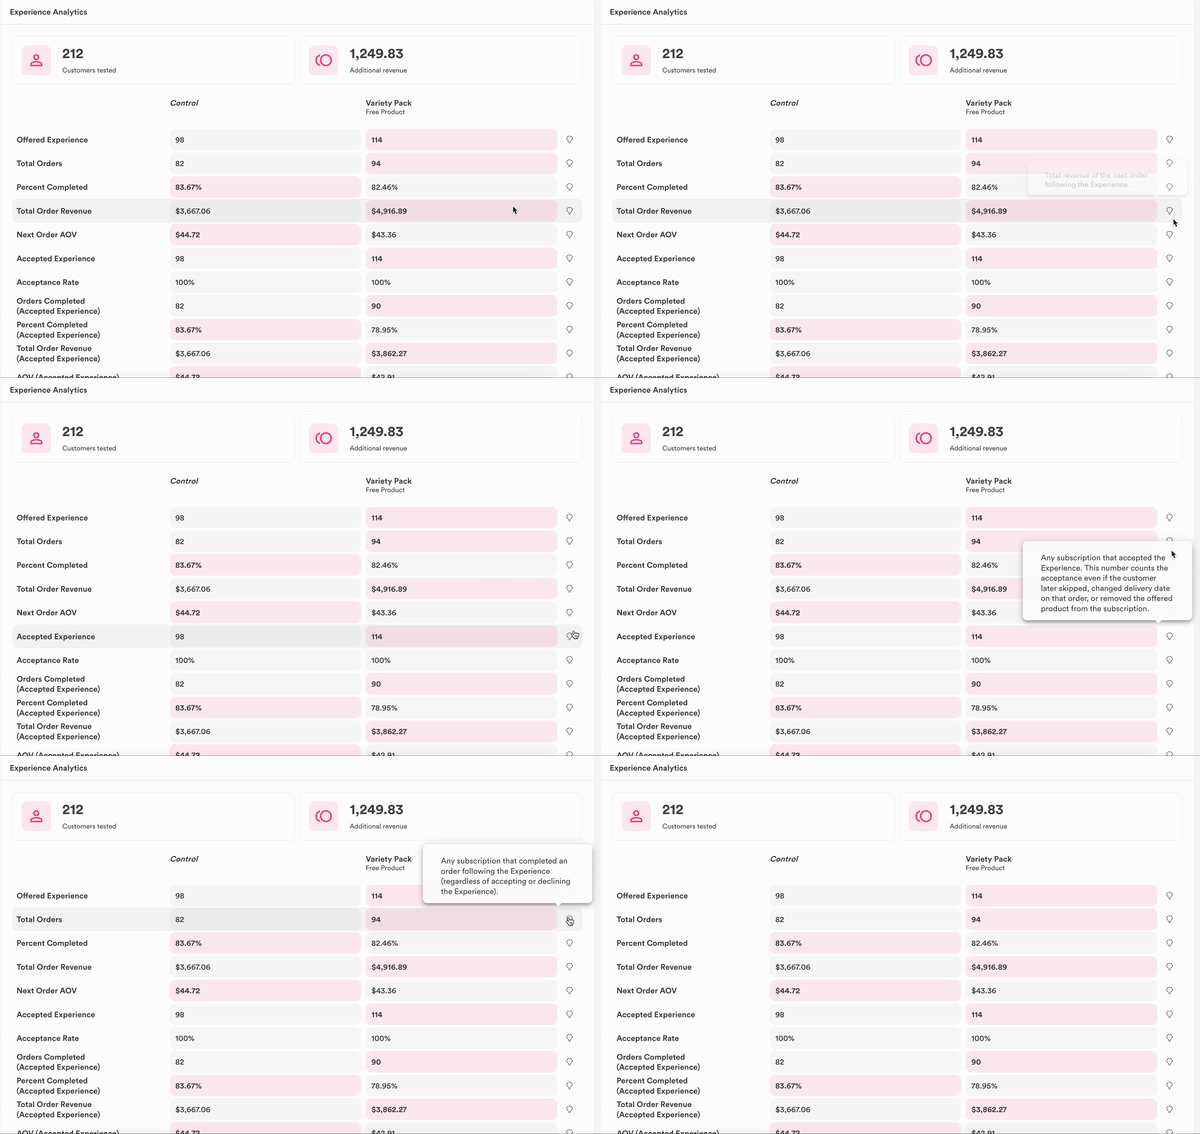
AI Enhanced Experimentation & Testing
Stay’s machine learning enables you to automatically leverage our predictive analytics to to identify customers likely to churn and ensure they get a personalized offer. Our AI can also auto optimize feature performance over time.
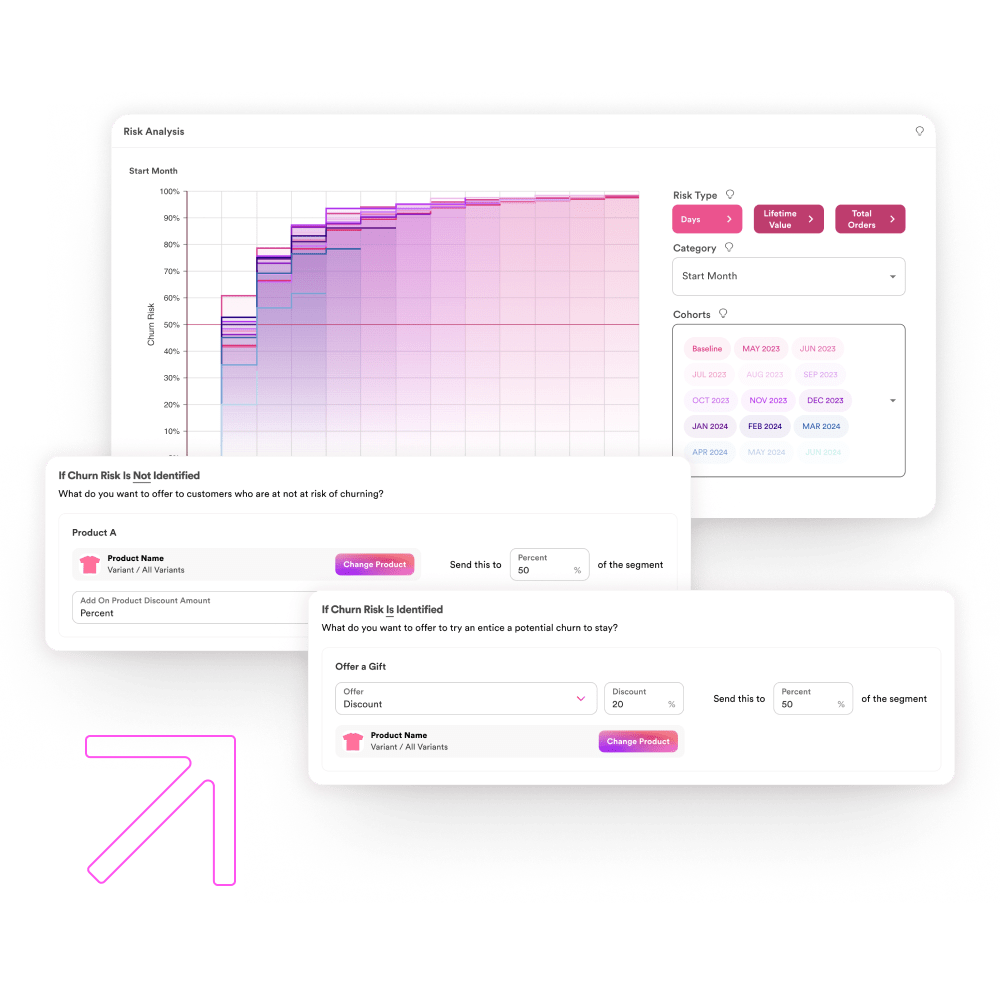
A/B Testing With ExperienceEngine™
Learn more about ExperienceEngine, our powerful promotions builder with built in A/B testing and reporting.